Tutorial for using stagewiseNN
Here is a tutorial of using StagewiseNN to build the single-cell graph and developmental tree from scratch, i.e., using the raw count data.
The sample data used here is a 20%-subsample (29775 cells) of the original scRNA-seq data (~140k cells), which can be download from here.
Note that any normalized data-matrix (with stage labels) can be run with StagewiseNN.
[1]:
import os
import sys
from pathlib import Path
from typing import Sequence, Mapping, Optional, Union, Callable
import logging
import pandas as pd
import numpy as np
import scanpy as sc
if the package is not installed, you can also import it by appending the swnn’s parent directory to sys.path.
[2]:
ROOT = Path('../')
sys.path.append(str(ROOT))

import swnn
from swnn import describe_dataframe, set_adata_hvgs, change_names
0 Setting paths and load data
[3]:
resdir = ROOT / '_temp'  # The result directory, reset by user!
swnn.check_dirs(resdir)
already exists:
        ../_temp
Load the sample data (as an AnnData object)
[4]:
DATADIR = ROOT / 'sample_data'                     # reset by user!
path_adata = DATADIR / 'subsampled_B-L0-0.2.h5ad'  # reset by user!

adata_raw = sc.read_h5ad(path_adata)
adata_raw
[4]:
AnnData object with n_obs × n_vars = 29775 × 24410
    obs: 'stage_id', 'primer', 'n_genes', 'n_counts', 'stage_primer', 'stg_leiden', 'stage_stg_leiden', 'refined_group', 'leiden_new', 'parent_bcd', 'lineage', 'stage_name', 'stagewise_cluster'
    uns: 'lineage_colors'
[5]:
# swnn.describe_dataframe(adata_raw.obs)
1 preprocessing
1.1 Normalize data and compute HVGs from scratch
Here we list two ways of normalization (where the first way is most commonly adopted):
[6]:
# way 1, the most commonly adopted
adata_norm = swnn.normalize_default(adata_raw, target_sum=None, copy=True, )
[7]:
# way 2, less general, but works better for SplitSeq data (our sample data) in practice
adata_norm1 = swnn.normalize_log_then_total(adata_raw, target_sum=None, copy=True, )
1.2 Select HVGs from each group (stage) of data
[8]:
adata = adata_norm1
# adata = adata_norm
hvg_freq, hvg_dict = swnn.groupwise_hvgs_freq(adata, groupby='stage_name')
Take the HVGs that are detected on more that 3 stages:
[9]:
hvgs = swnn.take_high_freq_elements(hvg_freq, min_freq=3)
print('Total of %d HVGs are used.' % len(hvgs))
Total of 4613 HVGs are used.
NOTE
If you have already computed the HVG frequencies, you can directly load them, and take ones with high-frequencies.
hvg_freq = pd.read_csv(path_hvg_freq, index_col=0, header=None).iloc[:, 0].to_dict()
hvgs = swnn.take_high_freq_elements(hvg_freq, min_freq=3)
Next, set HVGs to adata
[10]:
adata = set_adata_hvgs(adata, gene_list=hvgs)
1.3 Compute z-scores
Centering and scaling to unit variances, grouped by each “batch” (specified by the groupby parameter).
[11]:
batch_key = 'stage_primer'
swnn.wrapper_scale(adata, groupby=batch_key)

adata, adata.X[:2, :]
[11]:
(AnnData object with n_obs × n_vars = 29775 × 4613
     obs: 'stage_id', 'primer', 'n_genes', 'n_counts', 'stage_primer', 'stg_leiden', 'stage_stg_leiden', 'refined_group', 'leiden_new', 'parent_bcd', 'lineage', 'stage_name', 'stagewise_cluster'
     var: 'highly_variable'
     uns: 'lineage_colors', 'log1p',
 array([[-0.28615636, -0.35525173, -0.12650372, ..., -0.25878315,
         -0.19844045, -0.20785098],
        [-0.19452356, -0.25703438, -0.0802073 , ..., -0.24499079,
         -0.11594469, -0.13195746]]))
2 The main process
2.0 Setting inputs and the parameters
[12]:
# ====== Inputs ======
data_matrix = adata.X
stage_order = ("B", "G3", "G4", "G5", "G6", "N0", "N1", "N3", "L0")
stage_labels = adata.obs['stage_name']

# only used for building tree, each group will be taken as a tree node
group_labels = adata.obs['stagewise_cluster']


# ====== Parameters ======
ks = [10] * 7 + [3] * 2  # specified for different stages
n_pcs = 30     # you can also set it a list like ``ks``
leaf_size = 1  # 1 for exact KNN
Initialize a Builder object:
[13]:
builder = swnn.Builder(stage_order=stage_order)
2.1 Building a (stage-wise) single-cell graph
[14]:
distmat, connect = builder.build_graph(
        X=data_matrix, stage_lbs=stage_labels,
        ks=ks, n_pcs=n_pcs,
        leaf_size=leaf_size,
    )
perform KNN searching: B in B
perform KNN searching: G3 in B
perform KNN searching: G4 in G3
perform KNN searching: G5 in G4
perform KNN searching: G6 in G5
perform KNN searching: N0 in G6
perform KNN searching: N1 in N0
perform KNN searching: N3 in N1
perform KNN searching: L0 in N3
2.1.1 Further visualization
Compute UMAP based on your precomputed single-cell-graph
[15]:
swnn.set_precomputed_neighbors(adata, distmat, connect)
sc.tl.umap(adata, min_dist=0.1)
WARNING: You’re trying to run this on 4613 dimensions of `.X`, if you really want this, set `use_rep='X'`.
         Falling back to preprocessing with `sc.pp.pca` and default params.
[16]:
sc.settings.figdir = resdir
sc.set_figure_params(fontsize=14)

sc.pl.umap(adata, color='lineage', ncols=1, save='_lineage.pdf')
sc.pl.umap(adata, color='stage_name', palette='plasma_r', save='_stage.pdf')
WARNING: saving figure to file ../_temp/umap_lineage.pdf
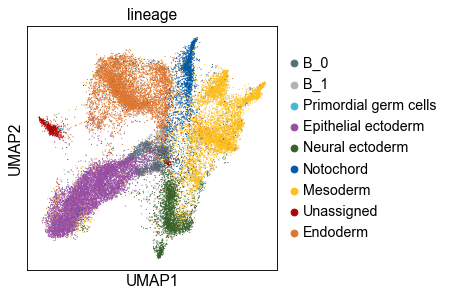
WARNING: saving figure to file ../_temp/umap_stage.pdf
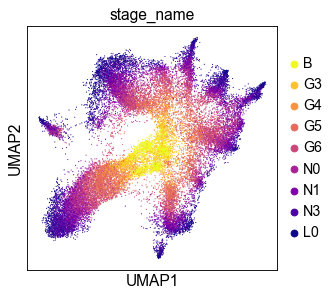
We can see that the UMAP-plot computed from the 20%-subsample is similar to that built from the full data.
2.2 Build a developmental tree from the single-cell graph
[17]:
edgedf, refined_group_lbs = builder.build_tree(group_labels, stage_labels,)
connecting stage B and G3
---> aggregating edges...
unique labels of rows: ['B_1' 'B_0' 'B_2']
unique labels of columns: ['G3_1' 'G3_0' 'G3_3' 'G3_4' 'G3_2' 'G3_5']
grouping elements (edges)
shape of the one-hot-labels: (1596, 3) (1826, 6)
parent nodes that had no descendent: ['B_2']
Taking descendant-points from other nodes (groups)
pasting stage labels
---> aggregating edges...
unique labels of rows: ['B_1' 'B_0' 'B_2']
unique labels of columns: ['G3_1' 'G3_0' 'G3_3' 'G3_4' 'G3_2' 'G3_5' 'G3_6']
grouping elements (edges)
shape of the one-hot-labels: (1596, 3) (1826, 7)

connecting stage G3 and G4
---> aggregating edges...
unique labels of rows: ['G3_0', 'G3_1', 'G3_2', 'G3_3', 'G3_4', 'G3_5', 'G3_6']
unique labels of columns: ['G4_0' 'G4_4' 'G4_2' 'G4_3' 'G4_1']
grouping elements (edges)
shape of the one-hot-labels: (1826, 7) (1477, 5)
parent nodes that had no descendent: ['G3_3', 'G3_6']
Taking descendant-points from other nodes (groups)
pasting stage labels
---> aggregating edges...
unique labels of rows: ['G3_0', 'G3_1', 'G3_2', 'G3_3', 'G3_4', 'G3_5', 'G3_6']
unique labels of columns: ['G4_0' 'G4_4' 'G4_2' 'G4_3' 'G4_1' 'G4_5']
grouping elements (edges)
shape of the one-hot-labels: (1826, 7) (1477, 6)

connecting stage G4 and G5
---> aggregating edges...
unique labels of rows: ['G4_0', 'G4_1', 'G4_2', 'G4_3', 'G4_4', 'G4_5']
unique labels of columns: ['G5_2' 'G5_0' 'G5_3' 'G5_1' 'G5_5' 'G5_8' 'G5_6' 'G5_4' 'G5_7']
grouping elements (edges)
shape of the one-hot-labels: (1477, 6) (4098, 9)
parent nodes that had no descendent: ['G4_5']
Taking descendant-points from other nodes (groups)
pasting stage labels
---> aggregating edges...
unique labels of rows: ['G4_0', 'G4_1', 'G4_2', 'G4_3', 'G4_4', 'G4_5']
unique labels of columns: ['G5_2' 'G5_0' 'G5_3' 'G5_1' 'G5_5' 'G5_8' 'G5_6' 'G5_4' 'G5_7' 'G5_9']
grouping elements (edges)
shape of the one-hot-labels: (1477, 6) (4098, 10)

connecting stage G5 and G6
---> aggregating edges...
unique labels of rows: ['G5_0', 'G5_1', 'G5_2', 'G5_3', 'G5_4', 'G5_5', 'G5_6', 'G5_7', 'G5_8', 'G5_9']
unique labels of columns: ['G6_1' 'G6_0' 'G6_3' 'G6_4' 'G6_8' 'G6_7' 'G6_5' 'G6_6' 'G6_2']
grouping elements (edges)
shape of the one-hot-labels: (4098, 10) (4775, 9)
parent nodes that had no descendent: ['G5_8', 'G5_9']
Taking descendant-points from other nodes (groups)
pasting stage labels
---> aggregating edges...
unique labels of rows: ['G5_0', 'G5_1', 'G5_2', 'G5_3', 'G5_4', 'G5_5', 'G5_6', 'G5_7', 'G5_8', 'G5_9']
unique labels of columns: ['G6_1' 'G6_0' 'G6_3' 'G6_4' 'G6_8' 'G6_7' 'G6_5' 'G6_6' 'G6_9' 'G6_2'
 'G6_10']
grouping elements (edges)
shape of the one-hot-labels: (4098, 10) (4775, 11)

connecting stage G6 and N0
---> aggregating edges...
unique labels of rows: ['G6_0', 'G6_1', 'G6_2', 'G6_3', 'G6_4', 'G6_5', 'G6_6', 'G6_7', 'G6_8', 'G6_9', 'G6_10']
unique labels of columns: ['N0_6' 'N0_2' 'N0_8' 'N0_5' 'N0_4' 'N0_3' 'N0_1' 'N0_0' 'N0_9' 'N0_7']
grouping elements (edges)
shape of the one-hot-labels: (4775, 11) (4992, 10)
parent nodes that had no descendent: ['G6_9', 'G6_10']
Taking descendant-points from other nodes (groups)
pasting stage labels
---> aggregating edges...
unique labels of rows: ['G6_0', 'G6_1', 'G6_2', 'G6_3', 'G6_4', 'G6_5', 'G6_6', 'G6_7', 'G6_8', 'G6_9', 'G6_10']
unique labels of columns: ['N0_6' 'N0_2' 'N0_8' 'N0_5' 'N0_4' 'N0_3' 'N0_1' 'N0_0' 'N0_9' 'N0_7'
 'N0_10' 'N0_11']
grouping elements (edges)
shape of the one-hot-labels: (4775, 11) (4992, 12)

connecting stage N0 and N1
---> aggregating edges...
unique labels of rows: ['N0_0', 'N0_1', 'N0_2', 'N0_3', 'N0_4', 'N0_5', 'N0_6', 'N0_7', 'N0_8', 'N0_9', 'N0_10', 'N0_11']
unique labels of columns: ['N1_4' 'N1_3' 'N1_2' 'N1_0' 'N1_7' 'N1_6' 'N1_5' 'N1_8' 'N1_1' 'N1_9']
grouping elements (edges)
shape of the one-hot-labels: (4992, 12) (4399, 10)
parent nodes that had no descendent: ['N0_10', 'N0_11']
Taking descendant-points from other nodes (groups)
pasting stage labels
---> aggregating edges...
unique labels of rows: ['N0_0', 'N0_1', 'N0_2', 'N0_3', 'N0_4', 'N0_5', 'N0_6', 'N0_7', 'N0_8', 'N0_9', 'N0_10', 'N0_11']
unique labels of columns: ['N1_4' 'N1_3' 'N1_2' 'N1_0' 'N1_7' 'N1_6' 'N1_5' 'N1_8' 'N1_1' 'N1_9'
 'N1_10']
grouping elements (edges)
shape of the one-hot-labels: (4992, 12) (4399, 11)

connecting stage N1 and N3
---> aggregating edges...
unique labels of rows: ['N1_0', 'N1_1', 'N1_2', 'N1_3', 'N1_4', 'N1_5', 'N1_6', 'N1_7', 'N1_8', 'N1_9', 'N1_10']
unique labels of columns: ['N3_0' 'N3_6' 'N3_2' 'N3_8' 'N3_4' 'N3_10' 'N3_9' 'N3_1' 'N3_13' 'N3_3'
 'N3_7' 'N3_5' 'N3_11' 'N3_12']
grouping elements (edges)
shape of the one-hot-labels: (4399, 11) (4448, 14)
parent nodes that had no descendent: ['N1_3', 'N1_9', 'N1_10']
Taking descendant-points from other nodes (groups)
pasting stage labels
---> aggregating edges...
unique labels of rows: ['N1_0', 'N1_1', 'N1_2', 'N1_3', 'N1_4', 'N1_5', 'N1_6', 'N1_7', 'N1_8', 'N1_9', 'N1_10']
unique labels of columns: ['N3_0' 'N3_6' 'N3_2' 'N3_8' 'N3_4' 'N3_10' 'N3_9' 'N3_1' 'N3_13' 'N3_3'
 'N3_7' 'N3_5' 'N3_11' 'N3_12' 'N3_15' 'N3_14' 'N3_16']
grouping elements (edges)
shape of the one-hot-labels: (4399, 11) (4448, 17)

connecting stage N3 and L0
---> aggregating edges...
unique labels of rows: ['N3_0', 'N3_1', 'N3_2', 'N3_3', 'N3_4', 'N3_5', 'N3_6', 'N3_7', 'N3_8', 'N3_9', 'N3_10', 'N3_11', 'N3_12', 'N3_13', 'N3_14', 'N3_15', 'N3_16']
unique labels of columns: ['L0_4' 'L0_1' 'L0_0' 'L0_14' 'L0_6' 'L0_7' 'L0_12' 'L0_10' 'L0_11' 'L0_5'
 'L0_8' 'L0_2' 'L0_9' 'L0_16' 'L0_3' 'L0_15' 'L0_13']
grouping elements (edges)
shape of the one-hot-labels: (4448, 17) (2164, 17)
parent nodes that had no descendent: ['N3_4', 'N3_5', 'N3_11', 'N3_14', 'N3_15', 'N3_16']
Taking descendant-points from other nodes (groups)
pasting stage labels
---> aggregating edges...
unique labels of rows: ['N3_0', 'N3_1', 'N3_2', 'N3_3', 'N3_4', 'N3_5', 'N3_6', 'N3_7', 'N3_8', 'N3_9', 'N3_10', 'N3_11', 'N3_12', 'N3_13', 'N3_14', 'N3_15', 'N3_16']
unique labels of columns: ['L0_4' 'L0_1' 'L0_0' 'L0_14' 'L0_6' 'L0_7' 'L0_12' 'L0_10' 'L0_11' 'L0_5'
 'L0_8' 'L0_2' 'L0_9' 'L0_16' 'L0_19' 'L0_3' 'L0_15' 'L0_13' 'L0_21'
 'L0_18' 'L0_20' 'L0_17' 'L0_22']
grouping elements (edges)
shape of the one-hot-labels: (4448, 17) (2164, 23)
[18]:
edgedf.head()
[18]:
| node | parent | prop | |
|---|---|---|---|
| 0 | G3_1 | B_1 | 0.676985 |
| 1 | G3_0 | B_0 | 0.985633 |
| 2 | G3_3 | B_0 | 0.581227 |
| 3 | G3_4 | B_0 | 0.946490 |
| 4 | G3_2 | B_0 | 0.584790 |
The values in ‘prop’ column of edgedf is the voting proportions from ‘node’ to the most likely ‘parent’.
[ ]:
# save the results
edgedf.to_csv(resdir / 'edgedf.csv')

# set the refined labels
adata.obs['refined_group'] = refined_group_lbs